



The FOMC’s last meeting minutes are due to be released today, with the commentary potentially influencing the precious metal’s direction.
Research Takeaway
Gold is moving in a downwards fashion as the FOMC’s last meeting minutes are due to be released during today’s late American trading session. Alongside the minutes, we would focus on commentary by Fed policymakers such as Fed Williams and Fed Kashkari who may amplify calls for a greater rate hike by the Fed, or in the unlikely scenario, downplay the need for further restrictive monetary policy.
Research Desk View: Bearish
Gold in One Minute
| Metric | View |
| Bias | Bearish |
| Primary Driver | DXY |
| Main Risk | Fed commentary |
| Key Level | Break below $3705 to preserve the thesis |
| Next Catalyst | FOMC meeting minutes · 18/11/2026 / 21:00 GMT+2 |
The Gold Thesis
The recent commentary by Fed policymakers has been hawkish in nature, with the door for a 50 basis point rate hike being open. In the bank’s minutes were relatively muted with no clear rate hike implications, the minutes could weigh on the greenback as they may be perceived as dovish in nature. Whereas, should the minutes indicate some hawkishness the expectations by market participants for the bank’s next meeting may remain relatively unchanged, as we already have some degree of Fed hawkishness priced in from their recent commentary. However, should the minutes be overtly hawkish, it could provide support for the dollar. Overall, the minutes could provide support for the greenback if they are hawkish in nature and vice versa.
Gold Drivers
| Driver | Signal | Rationale |
| Rates | Bearish | US10YR has increased since Nov 12th |
| FED | Bearish | Hawkish Fed commentary |
Key Events
| Event | Date / Time | Prior – Anticipated – Actual | Potential Impact on Gold |
| FOMC meeting minutes released | Wednesday / 21:00 GMT+2 | [Prior: N/A – [Anticipated: N/A] – [Actual: N/A] | Could weaken gold’s price |
| Fed Kashkari speaks | Wednesday / 23:15 GMT+2 | [Prior: N/A – [Anticipated: N/A] – [Actual: N/A] | Could weaken gold’s price |
Technical Context
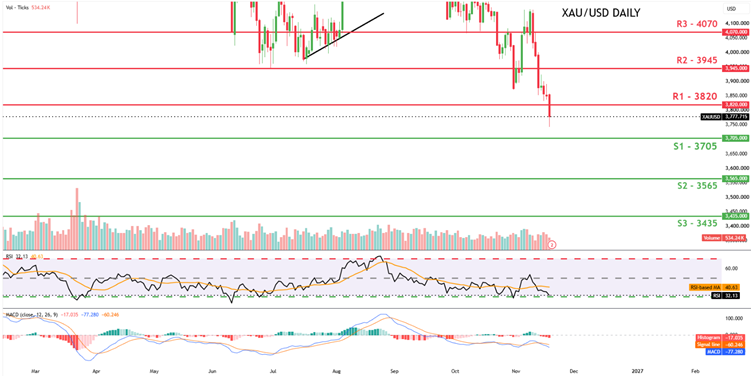
XAU/USD appears to be moving in a downwards fashion. We continue our bearish outlook view from a fundamental level, whilst from a technical level, we’d like to note the RSI indicator below our chart, which currently registers a figure of 33, implying strong bearish tendencies, alongside our MACD indicator. For our bearish outlook to be maintained we’d require a break below our 3705 (S1) support level if not also a testing of our 3565 (S2) support base. On the flip side, for a sideways bias we would require gold’s price to remain confined between our 3705 (S1) support level and our 3820 (R1) resistance line. Lastly, for a bullish outlook we would require a break above our 3820 (R1) resistance line if not also our 3945 (R2) resistance level with the next possible target for the bulls being our 4070 (R3) resistance level.
Short-Term Gold Levels
| Level | Price |
| Support (1) | $3705 |
| Support (2) | $3565 |
| Resistance (1) | $3820 |
| Resistance (2) | $3945 |
| Horizon | One week |
What Changes the View
| Signal | Development |
| 🟢 Confirms the Thesis | Hawkish Fed minutes |
| 🟢 Confirms the Thesis | Stronger USD |
| 🔴 Challenges the Thesis | US 10YR decline |
| 🔴 Challenges the Thesis | Dovish Fed commentary |
The Gold Lens
The precious metal is moving in a downward trajectory, as market participants anticipate further hawkish Fed commentary. The overall narrative appears to be dictating gold’s price as the dollar strengthens.
Key Variables to Remember
| Indicator | Bullish for Gold | Bearish for Gold |
| Real yields | Falling | Rising |
| US Dollar | Weakening | Strengthening |
| Fed expectations | More easing | More tightening |
| Central-bank demand | Increasing | Weakening |
| ETF flows | Inflows | Outflows |
| Risk environment | Uncertainty | Risk appetite |
DISCLAIMER: This content is for general informational and educational purposes only and should not be considered investment advice or investment recommendation.