






Research Takeaway
Gold is currently in a holding pattern as traders await the release of the US’s inflation print on Friday. The inflation data will be the last of its kind prior to the Fed’s decision next week and thus could lead to heightened trading volatility on the day of its release. Moreover, geopolitically speaking, tensions between the US and Iran could further escalate during the week, which could aid gold’s price to a certain degree.
Research Desk View: NEUTRAL
Gold in One Minute
| Metric | View |
| Bias | Bearish |
| Primary Driver | US CPI rates on Friday |
| Main Risk | Geopolitical tensions in the Middle East |
| Key Level | Hold above $4340 to preserve the thesis |
| Next Catalyst | US CPI rates · 11/09/2026 / 15:30 GMT+2 |
The Gold Thesis
Gold’s near-term path is shaped by the upcoming US CPI rates which are due out this Friday. The headline CPI rate on a yoy level is set to remain steady at 3.4%, whereas the Core CPI rate on a yoy level is anticipated by economists to come in at 2.4%, which would be lower than the prior rate of 2.5%. Overall, the narrative which emerges could point towards easing inflationary pressures in the economy on a core level, which could weigh on the greenback whilst providing support for gold’s price considering their inverse relationship with one another. However, should the inflation print showcase an acceleration it may have the opposite effect and could thus weigh on the bullion’s price. On another level, we should note that the yield on the US 10-year Treasury note held around 4.8% on Tuesday, hovering at its highest level since October 2023, which makes gold less appealing for investors considering it is not interest-bearing. Thus, should the yields on US Treasuries continue to rise, it may lead to outflows from the precious metal, which in turn could weigh on gold’s price.
Gold Drivers
| Driver | Signal | Rationale |
| Rates | Bearish | US 10YR Yields have risen |
| Risk Demand | Supportive | Elevated geopolitical uncertainty |
| FED | Bearish | Fed expected to hike next week |
Key Events
| Event | Date / Time | Prior – Anticipated – Actual | Potential Impact on Gold |
| US CPI YY | Friday / 15:30 GMT+2 | [Prior: 3.4%] – [Anticipated: 3.4%] – [Actual: N/A] | Could weaken gold’s price |
| US Core CPI YY | Friday / 15:30 GMT+2 | [Prior: 2.5%] – [Anticipated: 2.4%] – [Actual: N/A] | Could support gold’s price |
Technical Context
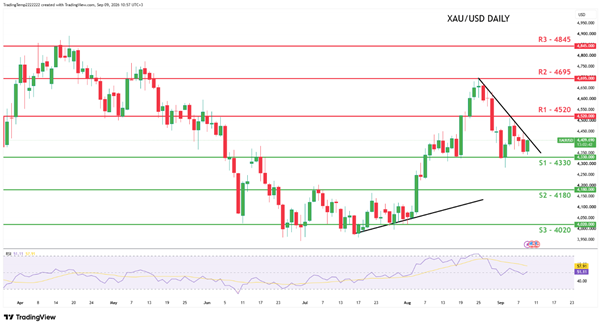
Gold appears to be moving in a sideways fashion on our chart after failing to clear our 4330 (S1) support level, whilst also attempt a jab at our 4520 (R1) resistance level. Momentum indicators such as RSI are registering a figure close to 50, implying a neutral market sentiment.
The market appears to have established structural levels at $4330 (S1) and $4520 (R1).For our sideways bias to be maintained we would require the bullion’s price to remain confined between our aforementioned S1 and R1 levels. On the other hand, for a bullish outlook we would require a clear break above our 4520 (R1) resistance line with the next possible target for the bulls being our 4695 (R2) resistance level. Lastly, for a bearish outlook we would require a clear break below our 4330 (S1) support level with the next possible target for the bears being our 4180 (S2) support line.
Short-Term Gold Levels
| Level | Price |
| Support (1) | $4330 |
| Support (2) | $4180 |
| Resistance (1) | $4520 |
| Resistance (2) | $44695 |
| Horizon | This week |
What Changes the View
| Signal | Development |
| 🟢 Confirms the Thesis | Easing inflationary pressures in the US economy |
| 🟢 Confirms the Thesis | Heightened geopolitical tensions |
| 🔴 Challenges the Thesis | Hotter-than-expected CPI rates |
| 🔴 Challenges the Thesis | Increase in appeal of US Treasury Bonds |
The Gold Lens
The US CPI rates are anticipated to showcase some easing of inflation on a core level, yet the focus is on the Fed next week thus a dovish market reaction could be limited to this week unless the inflation print brings about a surprise reading. On a geopolitical level, we’ve continued to note the increased risks for the Middle East as tensions continue to escalate. We would not be surprised to see further military action by both sides which could provide some support for gold prices.
Key Variables to Remember
| Indicator | Bullish for Gold | Bearish for Gold |
| Real yields | Falling | Rising |
| US Dollar | Weakening | Strengthening |
| Fed expectations | More easing | More tightening |
| Central-bank demand | Increasing | Weakening |
| ETF flows | Inflows | Outflows |
| Risk environment | Uncertainty | Risk appetite |