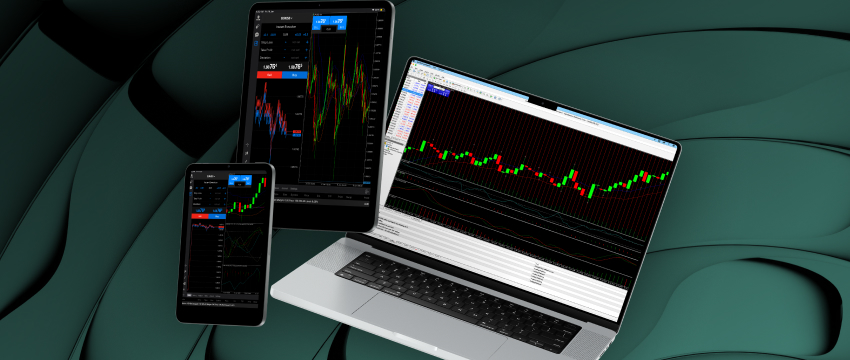






If you’ve ever tried to make sense of price patterns without the right tools, you know how frustrating it gets. Studying EURUSD historical data is a useful way to better understand currency behaviour, but only if you’re looking at it the right way and with the right platform.
Why Visualising EURUSD Historical Data Actually Matters
Raw numbers don’t tell you much on their own. A spreadsheet full of closing prices won’t immediately show you where EURUSD broke through a major support level during a volatile market event, but a chart will.
Visualisation turns raw data into useful context. You can spot trends, identify key support and resistance zones, and understand how the pair behaved during specific market events. That’s what separates traders who react from traders who anticipate.
Good tools also let you layer context onto your charts. Overlaying economic event markers onto historical price charts can reveal patterns you’d never catch by scrolling through a table.
What to Look for in a Visualisation Tool
Not every charting platform is built the same. Before you commit to one, check that it offers:
- Deep historical data, ideally going back several years at minimum
- Multiple timeframes, from 1-minute to monthly candles
- Customisable indicators and drawing tools
- Clean data exports if you want to run your own analysis
The last point matters more than people admit. Sometimes you want to pull EURUSD historical data into your own model or backtesting environment. If the platform locks that data behind a wall, it limits you.
The Best Tools for Charting EURUSD Historical Data in 2026
TradingView
TradingView remains one of the most widely used charting platforms among retail forex traders. Its EURUSD chart goes back years, and the interface makes it easy to switch between timeframes without losing your annotations.
What makes it particularly useful is the community layer. You can explore trading ideas and chart analysis shared by other traders, which can be helpful when comparing different views on EURUSD setups.
The free tier covers many basic charting needs. Paid plans increase indicator and historical intraday data limits, while data availability and update frequency can vary by market and data source.
MetaTrader 4 and MetaTrader 5
MT4 and MT5 are still the default environment for many forex traders, and for good reason. Both platforms give you direct access to EURUSD historical data through your broker’s trading environment. This can help align the data used for analysis and testing with that specific trading setup.
MT5’s built-in Strategy Tester uses historical data from the trading server and can test with broker-provided real ticks when available, making it particularly useful for detailed strategy testing.
One honest limitation: the charting interface feels dated compared to newer tools. It works well, but you won’t get the same visual polish as TradingView.
cTrader
cTrader has steadily built a strong reputation among more technically inclined traders. The platform handles historical forex data well, particularly for those running automated strategies through cBots.
Its charting tools are clean and responsive. Depth of market, tick charts, and multi-timeframe analysis are all built in without needing plugins.

Adding Market Context to EURUSD Historical Data
Beyond trading platforms, dedicated financial data services give you another layer of analytical depth. Platforms that aggregate forex data from multiple sources let you cross-reference EURUSD price history against economic releases, central bank decisions, and intermarket correlations.
Financial news sources such as MarketWatch and Reuters can add market context and commentary to the raw chart analysis you’re doing in your trading platform.
How to Use EURUSD Historical Data Without Getting Overwhelmed
This is where many traders run into problems. They load up five years of EURUSD historical data, add twelve indicators, and end up paralysed by conflicting signals.
Start narrow. Pick one timeframe that matches your trading style: daily charts if you’re a swing trader, four-hour if you’re more active. Learn to read price action on that timeframe before adding anything else.
Then add one indicator at a time and test whether it actually improves your read on the data. Moving averages are commonly used on daily EURUSD charts to help traders identify broader price trends. Oscillators are also commonly used to assess momentum and potential overbought or oversold conditions across different timeframes.
Building a Simple Backtesting Routine
You don’t need sophisticated software to start backtesting. Here’s a straightforward approach:
- Load at least 12 months of EURUSD historical data on your chosen timeframe
- Mark your entry and exit criteria clearly before scrolling forward
- Record each trade manually: entry price, exit price, reason for the trade
- Review the results after 50 or more sample trades
Aim for at least 50 sample trades as a starting point. A larger sample can give you a more reliable view of how consistently a strategy has performed.
The point isn’t to find a strategy that worked perfectly in the past. The point is to understand how the EURUSD pair tends to behave, and whether your approach has any genuine edge when applied to real historical conditions.
Choosing the Right Setup for Your Style
There’s no single best tool. A discretionary swing trader and an algo developer have completely different needs, even if they’re both analysing EURUSD historical data.
If you’re just starting out, TradingView’s free tier gives you more than enough to build solid chart-reading habits.
The goal is consistency: same data, same tools, same process. That’s how you build genuine pattern recognition over time.

Making EURUSD Historical Data Work for You
The value of EURUSD historical data ultimately depends on how you use it. Having access to years of price history won’t automatically improve your trading decisions. The real benefit comes from building a repeatable process for analysing charts, testing ideas, and reviewing how the currency pair has reacted under different market conditions.
Start with a platform that suits your level of experience and trading approach. A visual charting tool may be enough if your focus is on price action and technical analysis, while more advanced traders may prefer platforms with detailed historical data and built-in strategy testing features.
It’s also worth remembering that historical patterns are not guarantees. Economic conditions, central bank policies, interest rate expectations, and market sentiment can all change how EURUSD behaves. Historical price data should therefore be used as a research and analysis tool rather than a prediction of what the market will do next.
Whichever platform you choose, avoid constantly switching between tools and methods. Spend time learning the features available, keep a clear record of your analysis, and regularly review your results. A consistent approach can make EURUSD historical data far more useful than simply scrolling through old charts and looking for patterns after they have already happened.
For traders looking to put their market analysis into practice, Trading Sphere provides access to EUR/USD through trading platforms such as MT4 and MT5. Combining the right trading environment with a consistent approach to historical data analysis can help traders develop a more structured and informed process.
DISCLAIMER: This information is not considered as investment advice or an investment recommendation, but is instead a marketing communication.