



Gold prices appear to be moving in an upwards fashion as both the House and the Senate flip to the Democrats
Research Takeaway
Gold is moving in an upwards fashion following the Blue wave which emerged in the US Midterms yesterday. Specifically, control of the House of Representative and the US Senate have moved from the Republicans to the Democrats, which have made gains in historically Red states such as Texas. As a result, market participants have taken the result as bullish for gold prices, considering the fiscal implications of the Democrats controlling both houses.
Research Desk View: Bullish
Gold in One Minute
| Metric | View |
| Bias | Bearish |
| Primary Driver | DXY |
| Main Risk | US Employment data |
| Key Level | Clear above $4080 to preserve the thesis |
| Next Catalyst | US employment data · 06/11/2026 / 15:30 GMT+2 |
The Gold Thesis
The markets may be preparing for the US Employment data on Friday, in which the NFP figure is set to showcase an improvement, thus implying a stronger labour market. In turn, this could provide support for the dollar which in turn could weigh on the precious metal’s price. However, the NFP figure is notoriously difficult to predict even by economists and thus we could see heavy volatility in gold prices leading up to the release of the data. Furthermore, we’d like to note the Blue sweep in which Democrats took control of both the House of Representatives and the Senate, leading to market concerns which in turn could aid gold prices.
Gold Drivers
| Driver | Signal | Rationale |
| Rates | N/A | N/A |
| Risk Demand | Bullish | US may strike Iran |
Key Events
| Event | Date / Time | Prior – Anticipated – Actual | Potential Impact on Gold |
| US NFP figure | Friday / 15:30 GMT+2 | [Prior: 29k] – [Anticipated: 63k] – [Actual: N/A] | Could weaken gold’s price |
Technical Context
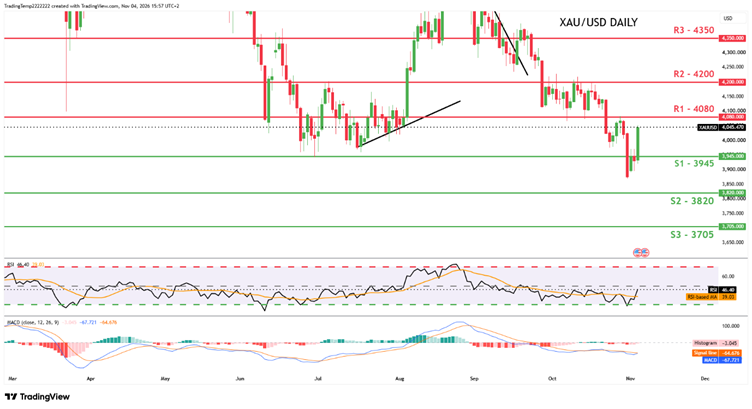
XAU/USD appears to be moving in a upwards fashion. We opt for a bullish bias for the bullion. For our bullish outlook to be maintained, we would require a break above 4080 (R1) resistance level with the next possible target for the bears being our 3820 (S2) . On the other hand, for a sideways outlook, we would require gold’s price to remain confined between our 3945 (S1) support level 4080 (R1) resistance line. Lastly, for a bearish outlook we would require a clear break below our 3945 (S1) support level, with the next possible target for the bears being our 3820 (S2) resistance line.
Short-Term Gold Levels
| Level | Price |
| Support (1) | $3945 |
| Support (2) | $3820 |
| Resistance (1) | $4080 |
| Resistance (2) | $4200 |
| Horizon | This week |
What Changes the View
| Signal | Development |
| 🟢 Confirms the Thesis | Loosening US Labour market |
| 🟢 Confirms the Thesis | More Democrat control in both houses |
| 🔴 Challenges the Thesis | Resilient US Labour market |
| 🔴 Challenges the Thesis | Dovish Fed commentary |
The Gold Lens
The upcoming US Employment data may be the next key test for market participants. However, with the Democrats taking control of both houses we could see the narrative shifting towards fiscal policy.
Key Variables to Remember
| Indicator | Bullish for Gold | Bearish for Gold |
| Real yields | Falling | Rising |
| US Dollar | Weakening | Strengthening |
| Fed expectations | More easing | More tightening |
| Central-bank demand | Increasing | Weakening |
| ETF flows | Inflows | Outflows |
| Risk environment | Uncertainty | Risk appetite |
DISCLAIMER: This information is not considered as investment advice or an investment recommendation, but is instead a marketing communication.