


Gold prices appear to be moving in a downwards fashion following the release of the US CPI rates.
Research Takeaway
Gold is moving in a downwards fashion as the US inflation print came in higher than expected, implying stubborn inflationary pressures in the US economy, on a core and headline level. Albeit, we should note that the inflation print was on a month-on-month basis, as the Government shutdown last year resulted in a lack of data being collected which could be used to produce the year-on-year rate. In turn, expectations for a Fed rate hike have been amplified post release, which could aid the greenback whilst weighing on gold’s price.
Research Desk View: Bearish
Gold in One Minute
| Metric | View |
| Bias | Bearish |
| Primary Driver | DXY |
| Main Risk | Fed rate hikes |
| Key Level | Break below $3945 to preserve the thesis |
| Next Catalyst | US PPI data · 13/11/2026 / 15:30 GMT+2 |
The Gold Thesis
The inflation print was important to some degree as it provided insight into the inflation narrative. Yet, we would focus on the comments made by Fed Governor Waller earlier on in the week, who opened the door for a 50 basis point rate hike. In particular he stated that “”a stronger policy move may be needed” if Core CPI rises 0.3% or more, which indeed occurred. Thus, market participants may be reaction of his other comment that “In that case, I believe a 50 basis point hike in the policy rate should be considered at the December meeting.” Hence, with Core mom inflation coming in at 0.3%, the 50 basis point rate hike scenario is on the menu. Furthermore, Chicago Fed President Goolsbee a known Dove, stated that the inflation report is “borderline disturbing” implying further support for a rate hike. In turn, these announcements tended to provide support for the greenback, which could weigh on gold’s price.
Gold Drivers
| Driver | Signal | Rationale |
| Rates | N/A | N/A |
| Risk Demand | Bearish | US-Iran tensions ease |
Key Events
| Event | Date / Time | Prior – Anticipated – Actual | Potential Impact on Gold |
| US Core PPI rates | Friday / 15:30 GMT+2 | [Prior: 0.7%] – [Anticipated: 0.3%] – [Actual: N/A] | Could support gold’s price |
Technical Context
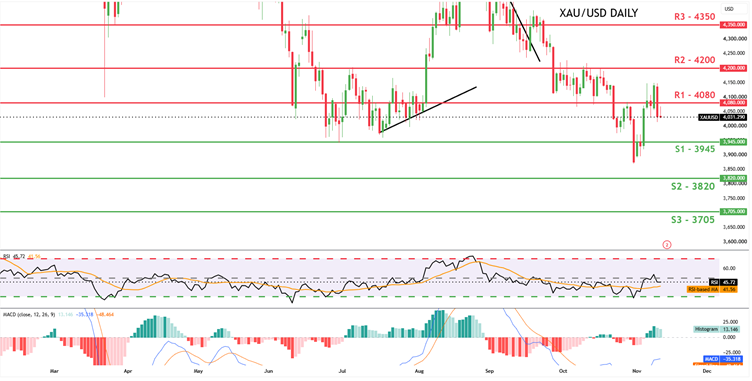
XAU/USD appears to be moving in a downwards fashion. We now opt for a bearish outlook from a fundamental level, whilst from a technical level, we’d like to note the RSI indicator below our chart which currently registers a figure of 45, implying some bearish tendencies. For our bearish outlook to be maintained we’d require a break below our 3945 (S1) support level if not also a testing of our 3820 (S2) support base. On the flip side, for a sideways bias we would require gold’s price to remain confined between our 3945 (S1) support level and our 4080 (R1) resistance line. Lastly, for a bullish outlook we would require a break above our 4080 (R1) resistance line with the next possible target for the bulls being our 4200 (R2) resistance level.
Short-Term Gold Levels
| Level | Price |
| Support (1) | $3945 |
| Support (2) | $3820 |
| Resistance (1) | $4080 |
| Resistance (2) | $4200 |
| Horizon | One week |
What Changes the View
| Signal | Development |
| 🟢 Confirms the Thesis | Hawkish Fed commentary |
| 🟢 Confirms the Thesis | Stronger USD |
| 🔴 Challenges the Thesis | Weaker PPI rates |
| 🔴 Challenges the Thesis | Dovish Fed commentary |
The Gold Lens
The precious metal is facing pressures as worries about inflation remain high. With comments emerging from both the doves and hawks which tend to imply further rate hikes, the stronger dollar could weigh on gold’s price given their inverse relationship.
Key Variables to Remember
| Indicator | Bullish for Gold | Bearish for Gold |
| Real yields | Falling | Rising |
| US Dollar | Weakening | Strengthening |
| Fed expectations | More easing | More tightening |
| Central-bank demand | Increasing | Weakening |
| ETF flows | Inflows | Outflows |
| Risk environment | Uncertainty | Risk appetite |
DISCLAIMER: This content is for general informational and educational purposes only and should not be considered investment advice or investment recommendation.