





If there is one concept that every trader eventually comes back to, it is support and resistance trading. No matter which markets you follow or which timeframe you prefer, these levels shape price behaviour in ways that are hard to ignore.
This article covers everything you need to know, from the basics to the practical steps, so you can approach the charts with more clarity and confidence.
What Is Support and Resistance Trading?
Support and resistance are price zones where the market has historically paused, reversed, or consolidated. A support level is a price point where buying interest tends to appear. A resistance level is where selling pressure tends to build.
Think of them as invisible floors and ceilings on a chart. Price bounces off the floor or gets turned back at the ceiling. The stronger the level, the more times it has been tested.
This approach is not about predicting exactly where price will go. It is about identifying zones where the probability of a reaction is higher than average. That distinction matters enormously.

Why Support and Resistance Trading Still Works in 2026
Why These Levels Hold Relevance
Marchés change. Technology changes. But human behaviour, greed, fear, hesitation, does not change much at all. Support and resistance levels exist because enough traders are watching the same zones and making decisions at the same points.
In March 2026, MarketWatch ran an opinion piece noting that the S&P 500 had broken a major support level, with analysts suggesting another 10% decline was likely. That kind of analysis draws on exactly the principles covered here. When large participants talk about broken support in public, it reinforces how central these concepts remain to market analysis.
Price Memory
Markets have memory. If price reversed sharply from a level three months ago, traders will watch that same level again. That attention creates self-fulfilling behaviour around key zones.
Supply and Demand Clusters
Support and resistance often mark areas where supply and demand are concentrated. A breakout above resistance signals that buyers have overwhelmed sellers at that zone. A breakdown below support signals the opposite.
Psychological Round Numbers
Round numbers tend to act as natural support and resistance. Traders place orders around these figures. The accumulation of orders at the same price point creates a zone of significance.
Role Reversal
When price breaks through a resistance level and holds above it, that level often becomes support. The reverse is also true. This principle, known as role reversal, is one of the most actionable ideas in support and resistance trading.
Consistency Across Timeframes
These levels work on a five-minute chart and on a monthly chart. The higher the timeframe, the more significant the level. A weekly support zone carries more weight than a fifteen-minute one.
Getting Started with Support and Resistance Trading
Step One: Identify the Key Levels on Your Chart
Start with a clean chart. Remove indicators if possible. Look for price areas where the market has reacted more than once. Two or more touches make a level worth noting. Three or more make it significant.
Look left on the chart. The more history you can see, the better your map of key zones will be.
Step Two: Categorise Each Level
Not all levels are equal. Once you have identified a zone, ask yourself:
- How many times has price tested this level?
- How sharp was the reaction each time?
- How recently was the level tested?
- Did the level cause a reversal or just a pause?
- Is this a major level visible on higher timeframes?
The answers tell you how much weight to give the level when planning a trade.
If the Level Has Been Tested Multiple Times Without Breaking
A level that has held repeatedly is considered strong. Traders treat these as high-priority zones. Price often approaches them with momentum but stalls or reverses before breaking through.
You might consider waiting for confirmation, a rejection candle, a shift in momentum, before acting on these levels. Entering blindly into a strong untested level can leave you exposed if the market breaks through.
If the Level Has Already Been Broken
A broken level is still useful. Watch for the role reversal principle to play out. Former resistance, once broken, can become support. Price often returns to retest the level before continuing in the new direction. That retest can be a lower-risk entry point.
Step Three: Align Your Plan with the Broader Market Context
A support level in a downtrend is far less reliable than one in an uptrend. Always know the broader market direction before placing too much confidence in any single level. Trading around these key levels works best when it aligns with the broader trend, not against it.
Practical Tips for Stronger Support and Resistance Trading
These are not abstract ideas. They are habits that sharpen your analysis over time.
Use Zones, Not Lines
Support and resistance are areas, not exact prices. Drawing a thin line on a chart looks precise but often misleads. Price does not always stop at an exact level. Drawing a zone gives you a more realistic picture of where the market might react.
Watch Volume Around Key Levels
Volume tends to increase as price approaches a significant level. High volume at support suggests strong buying interest. High volume at resistance suggests sellers are active. Volume alone does not give you a trade, but it adds useful context.
Do Not Chase Breakouts Blindly
Breakouts through support or resistance can be genuine or false. False breakouts, sometimes called fakeouts, draw in traders before price snaps back. Waiting for a candle to close beyond the level, rather than reacting mid-candle, filters out many false signals.
Here is what to check before acting on a breakout:
- Has the candle closed clearly beyond the level?
- Is volume supporting the move?
- Does the broader trend support the breakout direction?
- Has the level been approached from a consolidation rather than an extended move?
Combine Levels with Other Tools
Support and resistance trading gets stronger when it is combined with other tools. Moving averages can coincide with chart-based levels, adding confluence. Momentum indicators can show whether price has enough energy to break through or is likely to stall.
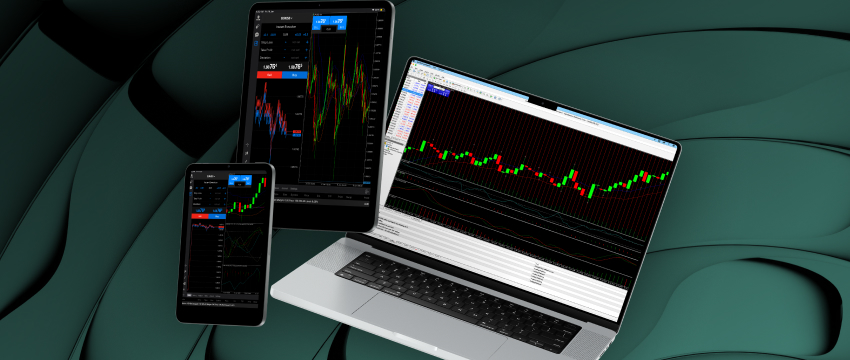
With Trading Sphere, you have access to a wide range of tradable instruments and advanced platforms like MetaTrader 4 and MetaTrader 5, which provide comprehensive charting, drawing tools, and technical indicators to help you identify and analyse support and resistance levels with confidence.
Mark Your Levels Before the Session Opens
Reactive trading, drawing levels while price is already moving, leads to poor decisions. Mark your key zones before the market opens. Know in advance where you will pay attention and what you will watch for. This keeps you out of impulsive entries driven by fast-moving price action.

Avoiding Common Mistakes in Support and Resistance Trading
Most new traders over-draw their charts. Every minor high and low gets a line. The chart becomes cluttered, and the noise drowns out the signal.
Focus on the levels that have caused the most significant reactions. Fewer, higher-quality levels will always serve you better than a chart full of lines you are no longer sure what to do with.
A second common mistake is treating these levels as guarantees. They are not. Price breaks through support and resistance regularly. The goal is to identify where the probability of a reaction is higher, manage your risk accordingly, and accept that not every setup will work.
Trading Sphere’s Core account lets you start exploring live markets with a minimum deposit of $50. As your experience grows, you can upgrade to Core Plus, Core Prime, or Core Elite, each tier offering tighter spreads and enhanced conditions, all within the same platform.
Bringing It All Together
Support and resistance trading is one of the most enduring frameworks in technical analysis, and for good reason. It is grounded in the reality of how markets move and how traders behave. The concepts are straightforward. The skill is in the consistent, disciplined application.
Start with clean charts. Identify the levels that have mattered most. Use zones rather than lines. Align your analysis with the trend. And always manage your risk. That is where mastery begins.
If you are ready to put these principles into practice, open your account with Trading Sphere today and explore the full sphere of possibilities across global markets. Whether you are watching support hold or waiting for a resistance breakout, having the right platform around you makes a real difference.
DISCLAIMER: This content is for general informational and educational purposes only and should not be considered investment advice or investment recommendation.