
Multi-timeframe analysis is a trading technique that helps traders spot better entry points by examining price action across different time horizons.
This approach provides a clearer understanding of overall market direction, improves trade timing, and reduces the risk of entering positions at poor price levels.
Multi-timeframe analysis is widely used by professional traders because it allows them to see both the bigger trend and the smaller price movements within it. This combination improves decision-making and helps filter out low-quality setups.
Most traders stick to one timeframe and miss crucial context. They might see a buy signal on a 1-hour chart while completely ignoring that the daily trend points downward.
Understanding Multi-Timeframe Analysis Basics
Multi-timeframe analysis involves studying the same asset across three different time periods. You’ll typically use a long-term timeframe for trend direction, a medium-term for trade setup, and a short-term for precise entry timing.
A simple way to understand this is to think of it as zooming in and out on a map to get different levels of detail.
The monthly chart shows you the major highways (long-term trends). The daily chart reveals the city streets (medium-term patterns). The hourly chart shows you exactly where to park (entry points).
The key is maintaining alignment between timeframes. When all three timeframes point in the same direction, you’ve found a high-probability trade setup.
The Three-Timeframe Structure
Professional traders often use a 4:1 or 5:1 ratio between timeframes. If you’re trading on the 1-hour chart, you’d analyse the 4-hour chart for context and the daily chart for the bigger picture.
For day trading, you might use:
- 15-minute charts for entries
- 1-hour charts for setup identification
- 4-hour charts for trend direction
Swing traders typically examine:
- Daily charts for entries
- Weekly charts for setups
- Monthly charts for major trends
This separation between timeframes helps you filter market noise while still maintaining a clear understanding of overall structure.
How Chart Timeframes Work Together
Each timeframe tells part of the story. The longer timeframe shows the dominant trend that’s likely to continue. Shorter timeframes reveal temporary corrections within that trend.
When you see a pullback on a shorter timeframe that aligns with support on a longer timeframe, you’ve found a potential entry. The pullback gives you a better price while the longer timeframe confirms the overall direction.
Multi-timeframe analysis also helps you avoid false breakouts. A breakout might look convincing on a 5-minute chart but appear insignificant when viewed on the daily timeframe.
Reading Market Structure Across Timeframes
Market structure changes differently across timeframes. A strong uptrend on the daily chart might show choppy sideways action on the hourly chart. Understanding this relationship prevents you from fighting the bigger trend.
One of the most important concepts in multi-timeframe analysis is identifying confluence zones where multiple timeframes align at the same price levels.
These areas often become strong support or resistance because traders from different time horizons are watching them.
Setting Up Your Multi-Timeframe Trading System
Start by choosing your primary trading timeframe based on your trading style. Day traders might focus on 15-minute or 1-hour charts. Swing traders often use daily charts as their main timeframe.
Once you’ve selected your primary timeframe, choose timeframes that are 4-5 times larger and 4-5 times smaller. This gives you enough separation to see different market perspectives without overwhelming yourself with information.
Platform Setup for Efficiency
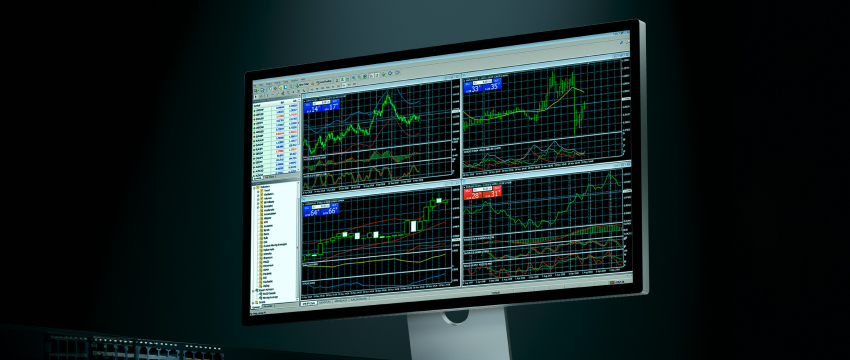
Most trading platforms allow multiple chart windows. Set up three charts of the same instrument using your chosen timeframes. Position them so you can see all three simultaneously without switching between tabs.
Identifying High-Probability Trade Entries
The best entries occur when all timeframes align in the same direction. Look for situations where the long-term trend, medium-term setup, and short-term entry signal all point toward the same trade.
Start your analysis with the longest timeframe. Identify the major trend direction and key support or resistance levels. Move to your medium timeframe to spot potential setups that align with the longer-term direction.
Finally, use your shortest timeframe to pinpoint exact entry levels. Look for patterns like flag breaks, pullback completions, or momentum divergences that signal the start of a new move.
This step-by-step approach improves timing precision and removes emotional bias from trading decisions.
Reading Momentum Across Timeframes
Momentum indicators behave differently on various timeframes. RSI might show oversold conditions on a 1-hour chart while remaining in uptrend territory on the daily chart. This divergence often creates trading opportunities.
Multi-timeframe analysis helps you distinguish between temporary momentum shifts and genuine trend changes. A momentum breakdown on a short timeframe might just be noise if the longer timeframes remain strong.
Common Multi-Timeframe Trading Strategies
The pullback strategy works well with multi-timeframe analysis. Identify a strong trend on your longest timeframe, wait for a pullback on your medium timeframe, then enter when the short timeframe shows the pullback is ending.
Breakout strategies also benefit from multiple timeframes. Confirm that a breakout on your entry timeframe aligns with the direction of longer-term trends. This filters out false breakouts that reverse quickly.
Both strategies rely heavily on alignment between timeframes, which is the core strength of multi-timeframe analysis.
Why Beginners Struggle with Multi-Timeframe Analysis
Many beginner traders struggle with multi-timeframe analysis because they switch between timeframes without a clear process. Instead of following a structured top-down approach, they jump randomly between charts, which leads to confusion and inconsistent decisions.
The key to improving is discipline and repetition. By always starting from the higher timeframe and working down step by step, traders develop a consistent framework for analysis. Over time, this creates stronger pattern recognition and reduces emotional decision-making.
Multi-timeframe analysis becomes more effective when it is treated as a fixed system rather than a flexible guessing method. Consistency in applying the same process across all trades is what separates profitable traders from inconsistent ones.
Trend Continuation Setups
Trend Continuation Setups in Multi-Timeframe Analysis
Look for continuation patterns on your medium timeframe that align with the longer-term trend. Flag patterns, ascending triangles, and pullbacks to moving averages often provide excellent entry points.
The key is patience. Wait for all timeframes to align before entering. Rushing into trades when timeframes conflict often leads to poor results.
Multi-timeframe analysis transforms trading from guesswork into systematic decision-making. You’ll find yourself entering trades with greater confidence and better timing when you understand how different time horizons work together.

Final Thoughts
Multi-timeframe analysis transforms trading from guesswork into systematic decision-making. You’ll find yourself entering trades with greater confidence and better timing when you understand how different time horizons work together.
By consistently applying multi-timeframe analysis, traders can improve timing, reduce risk, and develop a more structured and disciplined trading approach.
CLAUSE DE NON-RESPONSABILITÉ : Ces informations ne constituent ni un conseil en investissement ni une recommandation d’investissement. Il s’agit d’une communication à caractère marketing.