

Many traders look at the Parabolic SAR, see a series of dots on the chart, and think they know how to use it. But there’s more to it than meets the eye, and overlooking the details can lead to poor trading decisions. It is a useful tool for identifying trends and spotting potential reversals, but getting the most out of it means understanding how it works, not just knowing how to read the dots.
What Is the Parabolic SAR?
Developed by J. Welles Wilder, who also created the RSI and ATR, the Parabolic SAR stands for “Stop and Reverse.” The name pretty much explains its purpose. It helps traders follow trends and spot potential reversal points where they may need to adjust or reverse their positions.
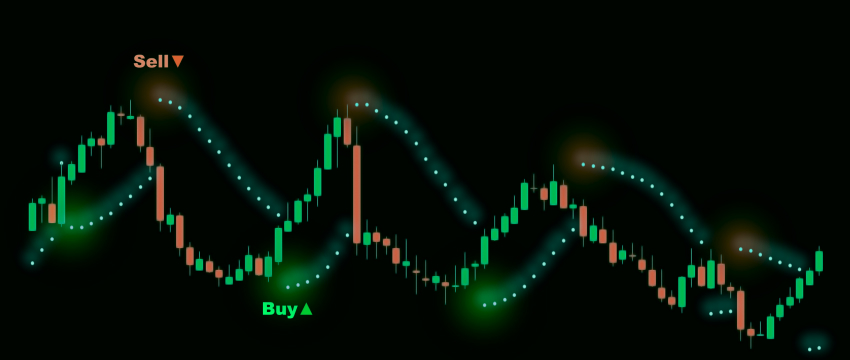
The indicator appears as a series of dots above or below the price on a chart. When the dots sit below the price, they generally signal an uptrend. When they move above the price, they typically indicate a downtrend. If the dots switch sides, it can signal a potential trend reversal and a possible stop-and-reverse point.
The concept is fairly easy to grasp at first. Things get more interesting, though, when you start exploring the indicator’s settings and how they affect its signals.
Understanding Parabolic SAR Settings
The Acceleration Factor
The Parabolic SAR is built around one key setting: the Acceleration Factor (AF). On many trading platforms, the default value is 0.02, while the maximum is typically set to 0.20.
The AF starts at a low value and increases whenever the price reaches a new high during an uptrend or a new low during a downtrend. As the AF increases, the SAR dots move closer to the price more quickly, making the trailing stop tighter.
So, how does this affect your trading?
- Low AF (such as 0.01): The dots tend to move more slowly, resulting in wider trailing stops and fewer reversal signals.
- Default AF (0.02): A common starting point for traders, including some swing traders who want a balance between responsiveness and filtering out market noise.
- High AF (0.03 or above): The indicator reacts more quickly to price changes, producing more signals but also increasing the risk of false reversals.
The key is finding a setting that suits your trading style and the market you’re trading. A faster indicator isn’t always better, especially when price movements are choppy and trends are less clear.
Adjusting Settings for Different Markets
There’s no single best setting for the Parabolic SAR that works in every situation. For example, a setting that works well on a daily EUR/USD chart might generate too many signals on a 15-minute chart.
In general, lower AF settings tend to work better for slower markets and longer timeframes, while faster-moving, more volatile markets may benefit from a slightly higher AF. The right choice depends on the instrument, timeframe, and your trading strategy.
Before using new settings in live trading, take the time to test them on a demo account. This lets you compare how the indicator performs under different market conditions without risking real money.
A demo account allows you to experiment with Parabolic SAR settings across different instruments and timeframes to find an approach that fits your trading style.
Reading Parabolic SAR Signals
Entry Signals
One of the easiest ways to read the Parabolic SAR is to watch for the dots to switch sides. When they move from above the price to below it, this may signal the start of an uptrend and a potential buying opportunity. When the dots move from below the price to above it, they may indicate the start of a downtrend and a possible selling opportunity.
However, these signals aren’t always reliable, especially when the market is moving sideways. That’s why it’s best not to rely on the the indicator alone. Combining it with another indicator, such as a moving average, RSI, or MACD, can help you assess the strength of a trend and filter out some weaker signals.
The goal is to use the dots as part of a broader trading strategy rather than treating every change in the dots as a reason to enter or exit a trade.
Exit and Stop-Loss Placement
One of the most practical uses of the Parabolic SAR is managing stop-loss levels. Instead of keeping your stop at a fixed price, you can use the SAR dots to trail it as the market moves in your favour. With each new dot, you get an updated level to help manage your exit.
For example, imagine you’re holding a long position in a strong uptrend. As the price rises, the SAR dots gradually move higher beneath it, giving you progressively higher levels to consider for your trailing stop. If the price eventually reverses and falls through the SAR level, your position may be closed if you’ve placed a stop order there.
Of course, this approach has its limitations. In choppy, sideways markets, the dots can switch sides frequently, potentially triggering repeated exits and making it harder to stay in a trade. That’s why it’s important to consider market conditions before relying on the indicator to manage your stops.
Common Mistakes Traders Make with Parabolic SAR
Mistake 1: Using It in Sideways Markets
The Parabolic SAR works best in trending markets, but it can struggle when prices move sideways. In a range-bound market, the dots may keep switching from above the price to below it and back again. These frequent flips can generate false signals, leading to unnecessary trades and potential losses.
Before relying on the indicator, take a moment to assess whether the market is actually trending. One way to do this is by using the Average Directional Index (ADX). Some traders look for an ADX reading above 25 as a sign that the trend may be strong enough for the dots to be more useful.
Keep in mind that ADX measures trend strength, not direction, and a reading above 25 doesn’t guarantee that a trend will continue. It’s best used alongside price action and other indicators to help you make more informed trading decisions.
Mistake 2: Treating Every Signal as an Entry
Not every Parabolic SAR signal is worth trading. Instead of treating every change in the dots as an entry opportunity, many traders use the indicator to help identify the market’s direction.
For example, when the dots appear below the price, they focus on potential long trades. When the dots move above the price, they look for short opportunities instead.
This approach makes the indicator a trend filter rather than a standalone entry signal. By combining it with other entry criteria, traders can be more selective about their setups instead of reacting to every dot-flip.
Mistake 3: Ignoring Timeframe Context
A Parabolic SAR signal on a 5-minute chart can mean something very different from one on a daily chart. Shorter timeframes generate more signals but also more noise and false reversals.
If you’re new to the indicator, start with a 4-hour or daily chart to identify trends more clearly and avoid reacting to every price movement.
Mistake 4: Never Adjusting the Default Settings
The default 0.02/0.20 settings are a good starting point, but they won’t work equally well in every market. Different assets behave differently. Some indices can trend steadily for days, while certain currency pairs may move sideways for hours before breaking out.
Take the time to test different settings on your preferred instrument and timeframe. Let the market guide your adjustments rather than sticking to defaults without checking how well they perform.
How to Add Parabolic SAR to Your Charts
The Parabolic SAR is available on most trading platforms. In MetaTrader 4 and MetaTrader 5, you can find it under the Trend Indicators section and add it to your chart in just a few clicks. You can also adjust the Acceleration Factor (AF) and maximum AF through the indicator settings.
Both platforms let you use it alongside other indicators, such as RSI or moving averages, making it easier to compare signals and look for trend confirmation.
Using Parabolic SAR as Part of a Broader Strategy

The Parabolic SAR works best as part of a broader trading strategy. On its own, it can produce misleading signals in choppy markets, but combining it with other tools can help you identify potential entries and manage exits more effectively.
A simple approach is to:
- Use a moving average to identify the overall trend.
- Use the Parabolic SAR to help time entries in that direction.
- Follow the SAR dots to adjust your trailing stop as the trade progresses.
This approach doesn’t guarantee profits, as markets can reverse at any time. However, combining the Parabolic SAR with trend confirmation gives its signals more context. Practising on a demo account is a useful way to test the strategy and see how it performs across different market conditions before risking real money.
DISCLAIMER: This content is for general informational and educational purposes only and should not be considered investment advice or investment recommendation.