







The US inflation data is set to be released later on today, with market participants closely watching the financial release in order to gauge insight into the US economy.
Research Takeaway
Gold appears to be moving in a downwards fashion, as market participants are awaiting the inflation data from the US for the month of September. In particular, economists have anticipated that both on a headline and core level, inflation in the US is expected to pick up. In turn, an uptick in inflation could increase pressure of the Fed to continue on their current monetary policy path which is restrictive, which in turn may aid the greenback whilst weighing on gold’s price.
Research Desk View: BEARISH
Gold in One Minute
| Metric | View |
| Bias | Bearish |
| Primary Driver | US CPI rates |
| Main Risk | Geopolitical tensions |
| Key Level | Hold below $4200 to preserve the thesis |
| Next Catalyst | US Inflation data · 14/10/2026 / 15:30 GMT+2 |
The Gold Thesis
The headline and core CPI rates are due to be released today. In particular, economists are currently anticipating the headline rate to come in at 3.6% and the Core rate at 2.5%. Thus, should the rates come in as expected or higher, which would imply an acceleration of inflationary pressures on the US economy, the pressure on the Fed to maintain a restrictive monetary policy stance could increase, which may aid the greenback whilst weighing on the precious metal’s price given the two instruments’ inverse relationship with one another.
Gold Drivers
| Driver | Signal | Rationale |
| Rates | Bearish | N/A |
| Risk Demand | Supportive | Elevated geopolitical uncertainty |
Key Events
| Event | Date / Time | Prior – Anticipated – Actual | Potential Impact on Gold |
| US CPI rate | Wednesday / 15:30 GMT+2 | [Prior: 3.4%] – [Anticipated: 3.6%] – [Actual: N/A] | Could weaken gold’s price |
| US Core CPI rate | Wednesday / 15:30 GMT+2 | [Prior: 2.4%] – [Anticipated: 2.5%] – [Actual: N/A] | Could weaken gold’s price |
Technical Context
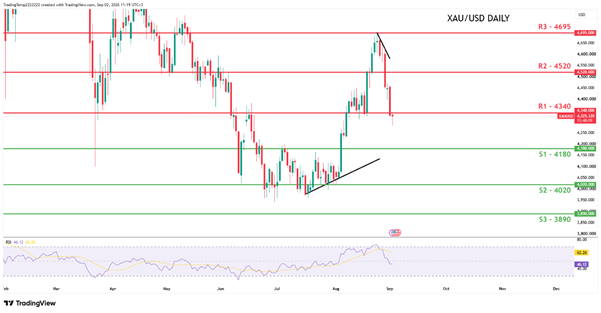
XAU/USD appears to be moving in a sideways fashion. We opt for a sideways bias for the bullion. For our sideways to be maintained, we would require gold’s price to remain confined between our 4080 (S1) support level and our 4200 (R1) resistance line. On the other hand, for a bearish outlook, we would require a break below our 4080 (S1) support level, with the next possible target for the bears being our 3945 (S2) support line. Lastly, for a bullish outlook, we would require a clear break above our 4200 (R1) resistance line, with the next possible target for the bulls being our 4350 (R2) resistance level. Lastly, for a sideways bias, we would require gold’s price to remain confined between our 4080 (S1) support level and our 4200 (R1) resistance line.
Short-Term Gold Levels
| Level | Price |
| Support (1) | $ 4080 |
| Support (2) | $3945 |
| Resistance (1) | $4200 |
| Resistance (2) | $4350 |
| Horizon | This week |
What Changes the View
| Signal | Development |
| 🟢 Confirms the Thesis | A strong inflation print |
| 🟢 Confirms the Thesis | Continued hawkish commentary from Fed policymakers |
| 🔴 Challenges the Thesis | Significant escalation between the US and Iran on a military level |
| 🔴 Challenges the Thesis | Weaker than expected US inflation data |
The Gold Lens
Houthi Rebels struck deep into Saudi Arabia this weekend, which could lead to heightened tensions in the Middle East
Key Variables to Remember
| Indicator | Bullish for Gold | Bearish for Gold |
| Real yields | Falling | Rising |
| US Dollar | Weakening | Strengthening |
| Fed expectations | More easing | More tightening |
| Central-bank demand | Increasing | Weakening |
| ETF flows | Inflows | Outflows |
| Risk environment | Uncertainty | Risk appetite |
DISCLAIMER: This content is for general informational and educational purposes only and should not be considered investment advice or investment recommendation.